Here at Eastside Co, we design and build some of the world's best Shopify and Shopify Plus websites. We pay attention to making sure the user experience is optimal - and a key part of that is understanding website performance, and what 'good' looks like. There are many types of website audit available, a speed audit being one of them.
This article aims to give a breakdown of how website speed audits work and how they can benefit your Shopify store.
First, let's start with why you would conduct a speed audit. The purpose is simple: how well will your Shopify site load for visitors using a variety of devices? Conducting an effective speed audit will identify how quickly it loads, and give you pointers on how to make it quicker. (Don't forget to check out our in-depth article on ways to increase the speed of your Shopify site once you've conducted your audit.)
A speed audit will show a comparison between how your Shopify site loads on desktop and on mobile. But there are some important caveats to keep in mind.

The Power to Run a Speed Audit
Running a website speed audit from your laptop will deliver misleading results. Or, it will if you have Lighthouse installed and you are hoping for real-time data.
First, there are many factors to consider when running an audit. There's a breakdown of the common myths coming in a moment. But first, the power to run the audit is something to keep in mind.
You could rely on PageSpeed Insights (PSI) as a speed audit tool. You could. But there is a key factor to remember:
PSI won't capture real-world bottlenecks. Or measure against real-world page Key Performance Indicators (KPIs)
PSI is a simulated environment to provide debugging for performance issues.
To find real-world bottlenecks and page KPIs you need a tool like Google Lighthouse. But you also need the hardware to run it.
While you can install Lighthouse on your laptop/desktop, the metric scores you get back will be on the low side. That's because Lighthouse uses throttling algorithms to create real-world bottlenecks and network latency.
That demands a lot of processing power from the hardware running it. Which is why, here at Eastside Co, we use a dedicated auditing server. It has loads of processing power to run audits on Shopify stores with all the throttling Google can throw at it.

A Word About PSI Results
PageSpeed Insights (PSI) from Google is a popular tool. It uses Lighthouse (also a Google tool) to run the audit. But keep in mind that it does so within a simulated environment.
There's a detailed discussion of the performance metrics and their meaning coming up. First, let's deal with those myths about the PSI results:
-
User experience comes from a single metric: no, this is not the case. You would need to assess the metrics from a host of values and not from a single time.
-
You can define a representative user: again, no. Users will visit your website from a variety of devices and network connections.
-
Your website loads fast for you so it will for everyone: no, not true. Network latency and network speed are two things that can change a user experience.
The performance data collected comes in two types: lab data and field data.
Lab Data
Lab data (produced by PSI) is performance data from a controlled environment. It uses presets for network and device settings. The idea is that you'll get a set of reproducible data for debugging purposes.
Field Data
Field data is performance data gathered from actual page loads. So it's data your users are experiencing in real terms.
The main difference is: the lab data that PSI produces has a wider range of metrics. The field data is more limited, but is a real user experience.
Performance Metrics Decoded
There are a couple of key points to understand before we get to the metric scores and their meaning.
Why Scores Fluctuate
Lighthouse will show fluctuations in the results of an audit. There are reasons for this and they are not anything to do with Lighthouse itself.
-
Served ads changing. If you are serving ads in your website or running A/B tests this will cause performance variances.
-
Internet traffic routing changes. The route to the Shopify site itself across the network may change.
-
Changes in the hardware used. A powerful desktop PC compared with a mobile device.
-
Antivirus software can cause bandwidth demands. That will result in audit result fluctuations.
-
Any browser extensions that inject JavaScript into the page.
Weighting
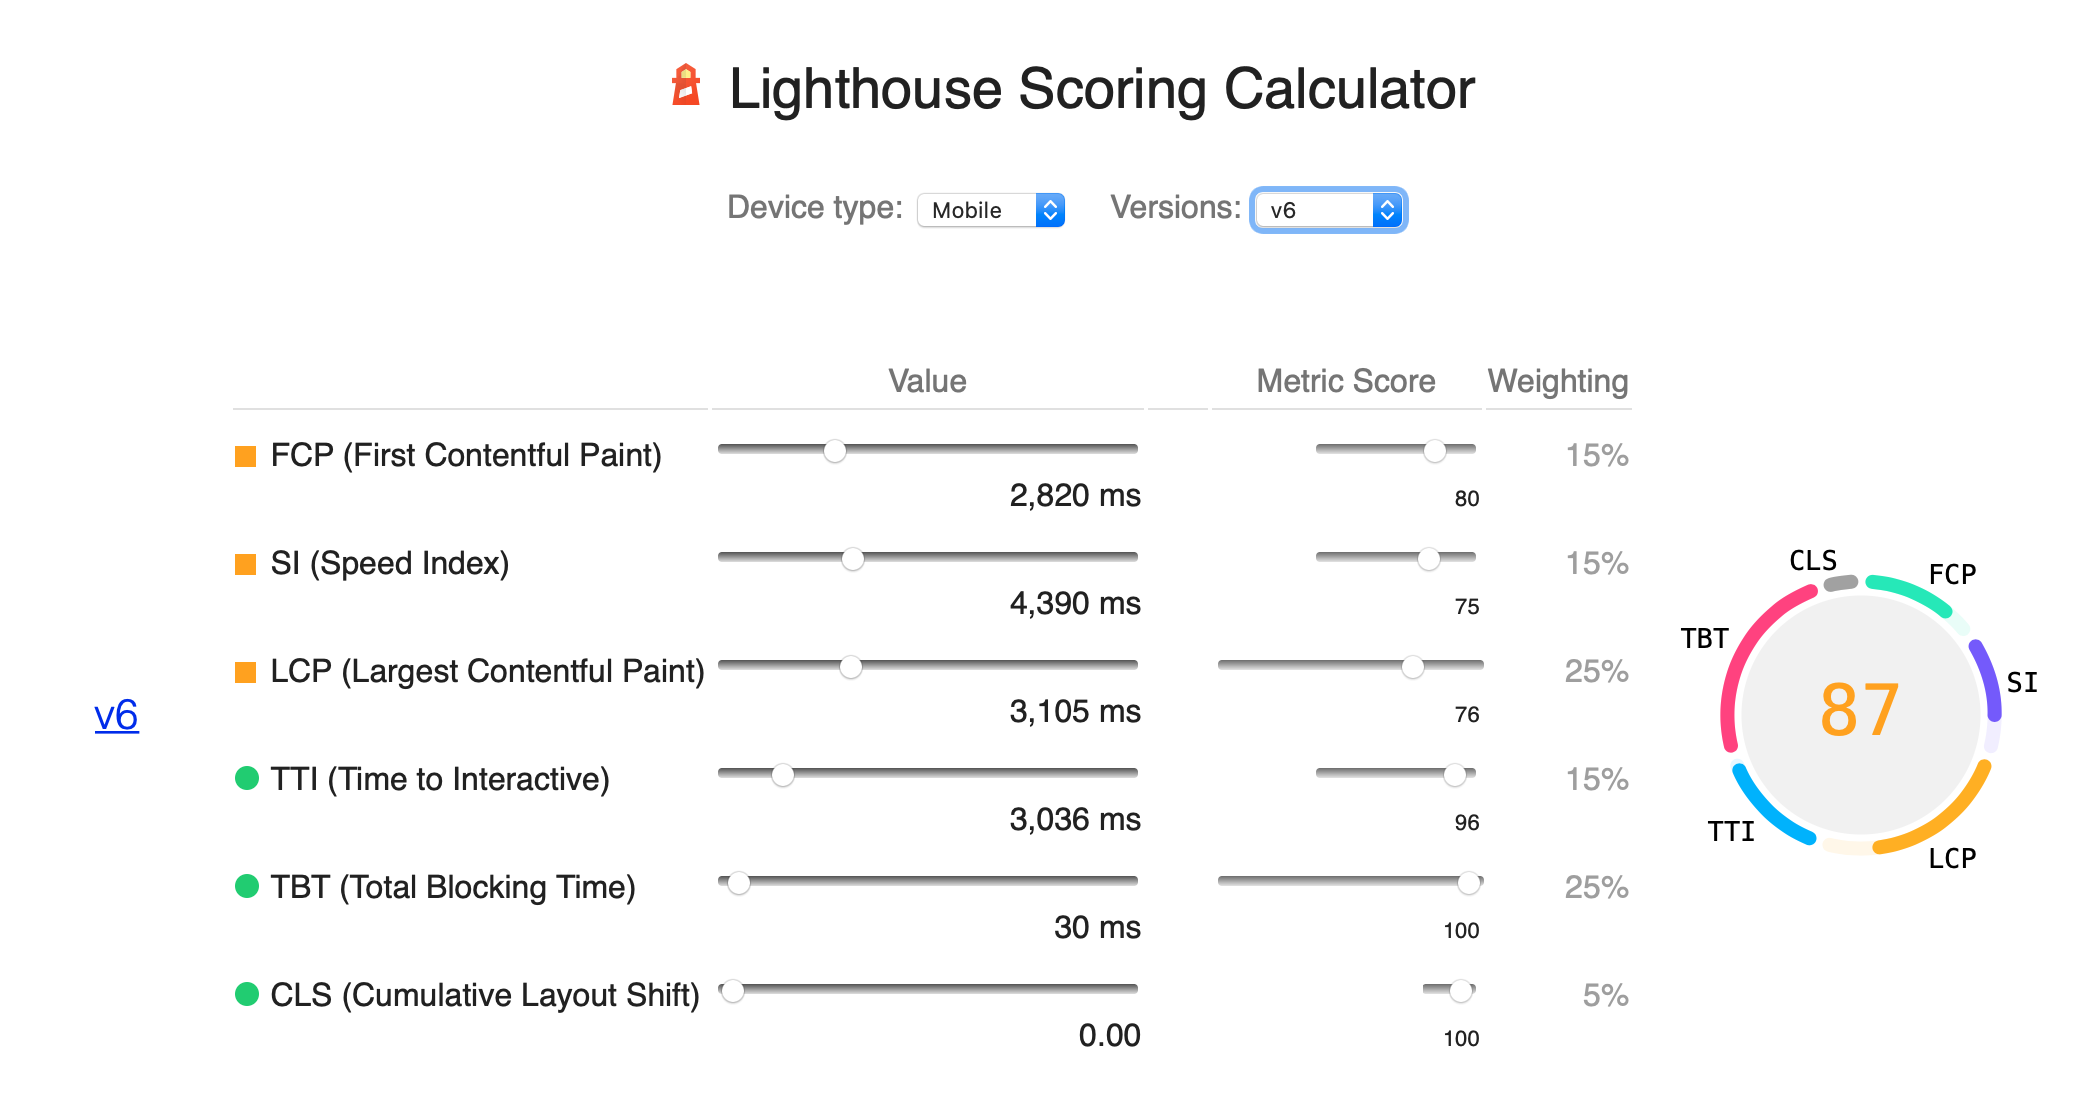
The metrics use a weighted average built into the Lighthouse algorithms. These weightings are not visible in the report. They provide a balanced measure of users perception of performance. This comes from the regular research the Lighthouse team do.

The Metrics for Shopify Site Speed Audits
Now we can run through the top level metrics to decode what they mean:
First contentful paint (FCP) - this metric measures how long it takes for the text above-the-fold to load. This is the content you see without needing to scroll. Too many fonts and large font files will affect this score. As will slow loading fonts from external resources.
Speed index (SI) - this metric records when visual changes above-the-fold stop. That means videos and hero images all affect the speed index score.
Largest contentful paint (LCP) - this metric seeks out the largest image or block of text. It measures how long it takes to load that item into the viewport. This could be a hero image or a large section of text.
Time to interactive (TTI) - this metric measures how long it takes for the page to be ready for user input. Late-loading apps and tracking or analytics scripts will affect this metric.
Total blocking time (TBT) - this metric is like TTI. But it measures the total amount of blocking time on page. This refers to the user not being able to click elements or to scroll the page.
Cumulative layout shift (CLS) - this metric measures visual stability. in other words, it measures how much the content shifts as the page loads making it hard to read or view the content.
Finally...
The main points about website speed audits are: there is lab data and field data. Lab data is a simulated environment and field data is realtime user experience. To run Lighthouse to see field data, you need the host machine to have as much processing power as possible. The lab data from PSI is ok for basic guidance and debugging purposes.
If you'd like to know more about our Shopify website speed audits, or how we can design and build a Shopify or Shopify Plus store for your ecommerce business, drop us a line!


